Project / Jul 18, 2026 / 7 min read
AI Acceleration Forecast: How Will AI Intelligence Evolve by 2028?
A data-backed AI acceleration forecast using 430 model releases to explore how frontier AI intelligence could evolve through spring 2027 and end-2028.
The launch of ChatGPT is easy to remember as a product moment. The chart behind this project made me look at it as a rate-of-change moment instead.
Artificial Analysis publishes a timeline of model releases against its Intelligence Index. The visible story is already dramatic: the frontier moved from 3.6 around the launch of ChatGPT to 59.9 by July 2026. But the more interesting question is not only how far the index moved. It is whether the speed of improvement has changed.
That question turned a chart inspection into a small forecasting project. I extracted the underlying release data, rebuilt the record-setting frontier, separated observed growth from fitted velocity, corrected an initially too-simple acceleration model, and then projected what continued acceleration could look like in spring 2027 and at the end of 2028.
This page documents the complete path, including the source chart, the formulas, the raw frontier records, the assumptions, and the limits of the result.
How will AI intelligence evolve?
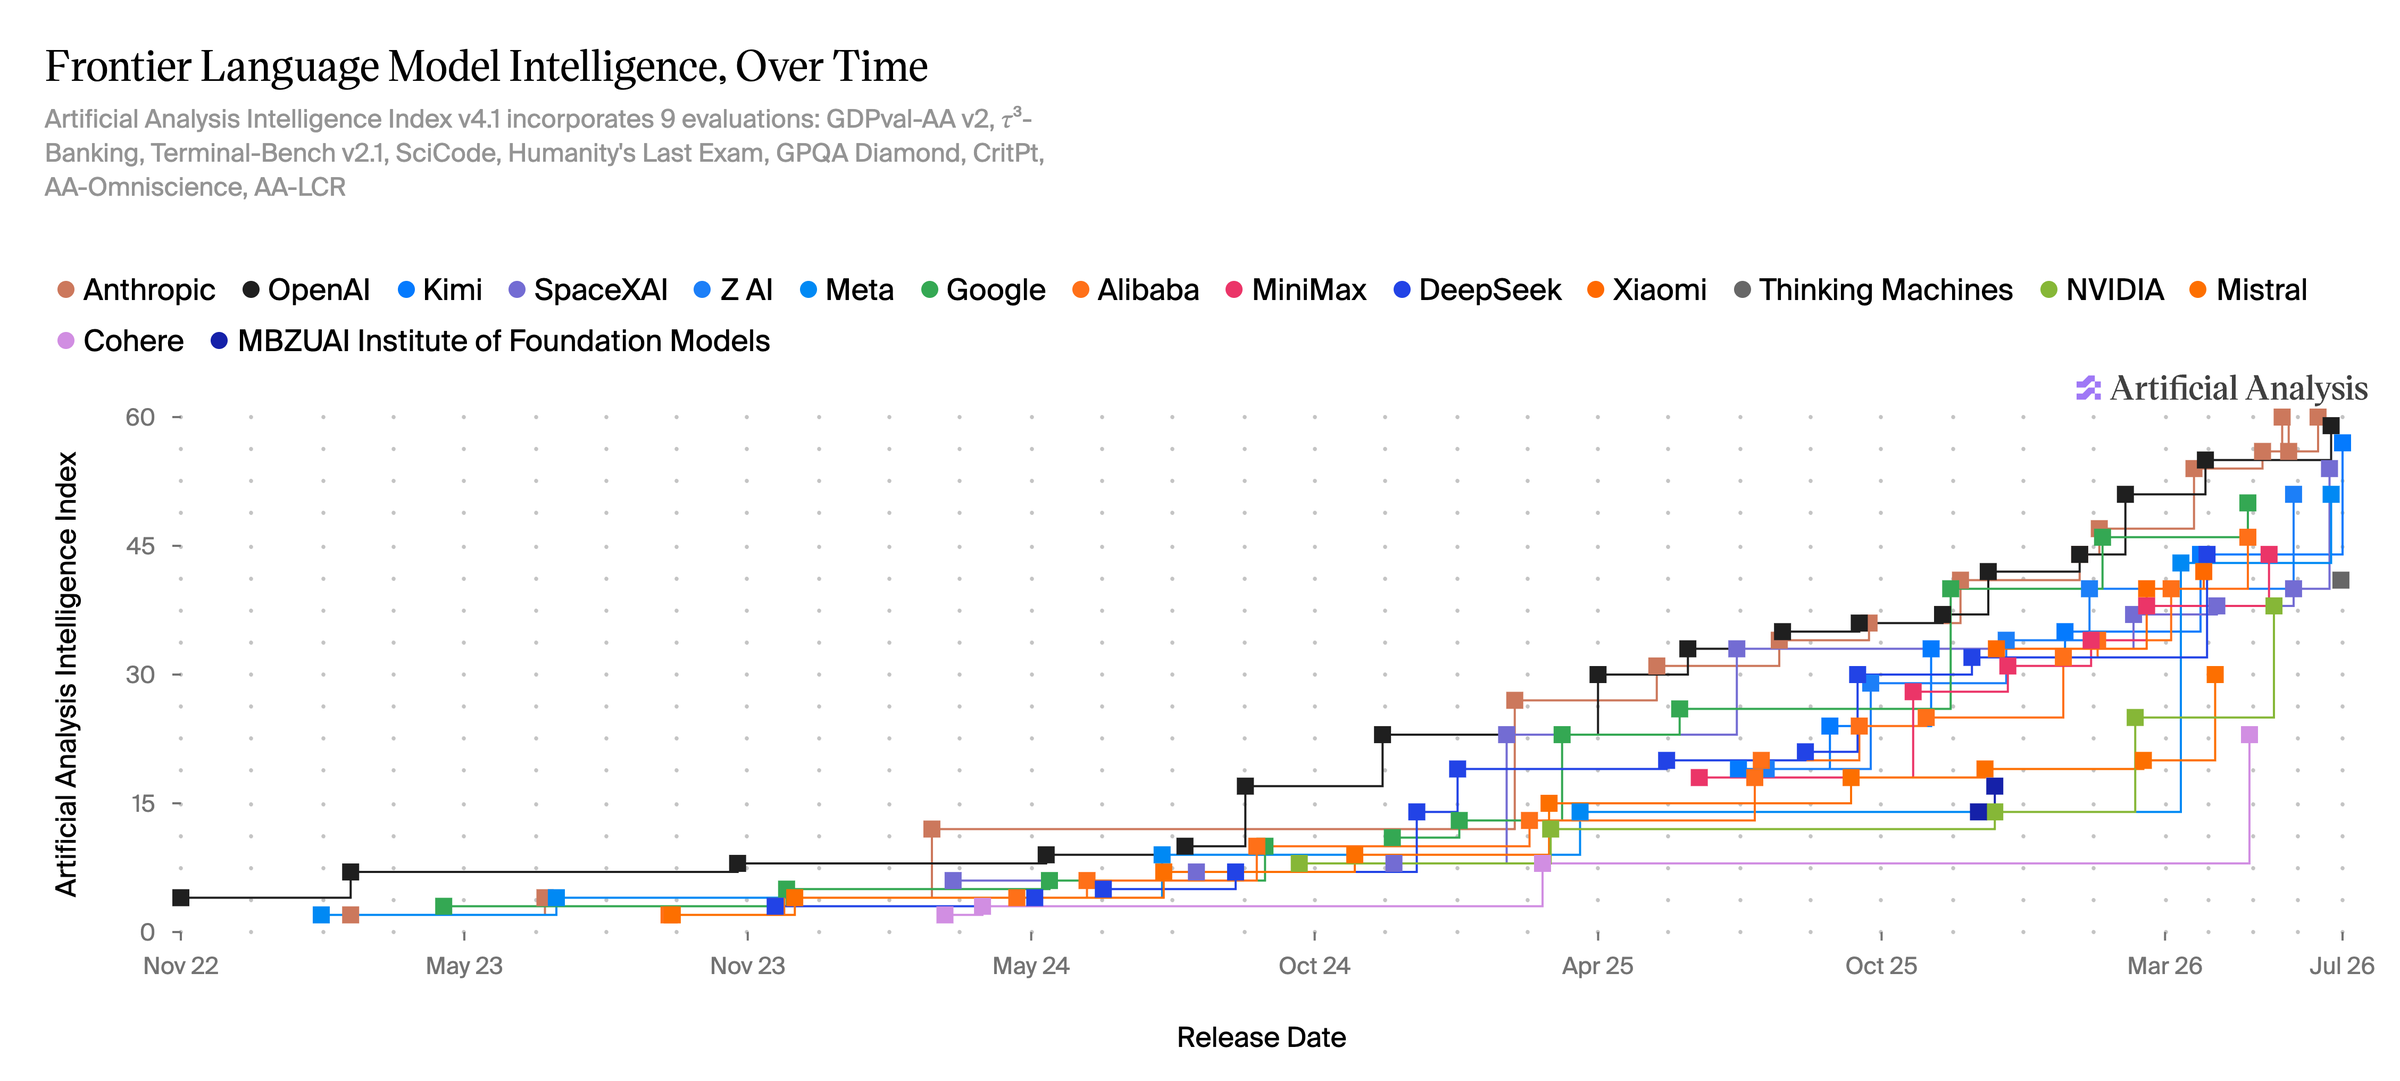
Source chart: Artificial Analysis Intelligence Index v4.1. The chart includes the selected model creators and release history used for this analysis.
The full page view made the density of releases even more obvious. OpenAI, Anthropic, Google, Kimi, Z AI, DeepSeek, Alibaba, Meta, xAI, MiniMax, Mistral, NVIDIA, Xiaomi, Cohere, Thinking Machines, and MBZUAI all appear in the selected set.
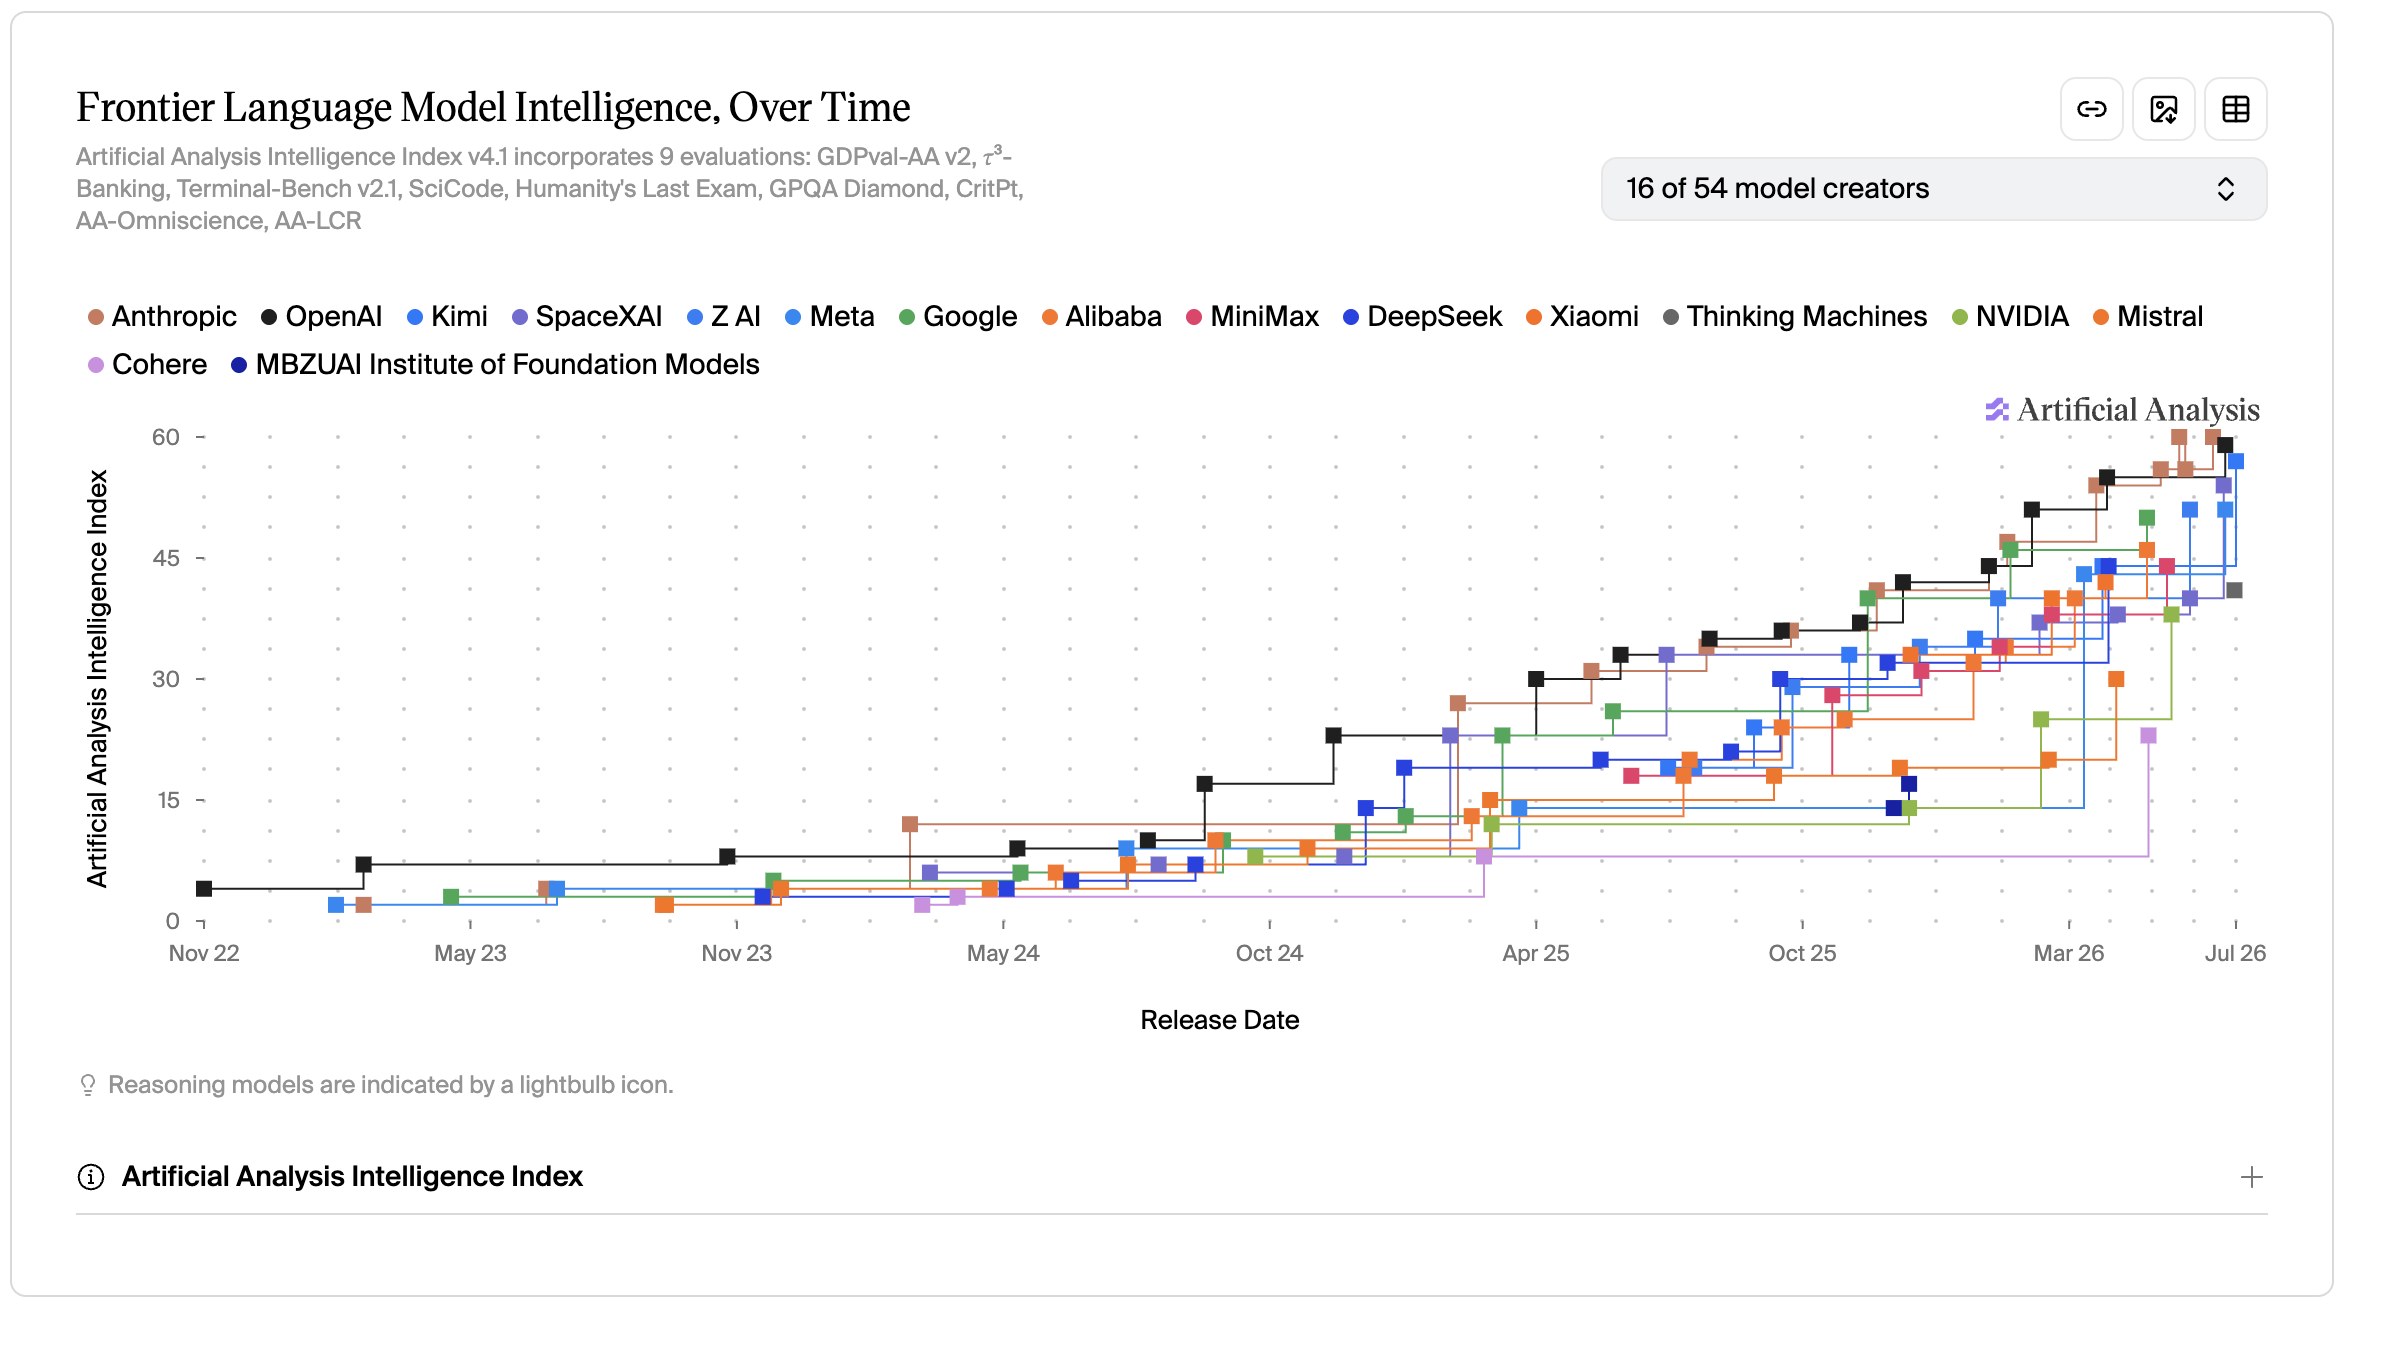
My first reaction was simple: let us stop eyeballing this and calculate it.
AI intelligence data and methodology
The analysis uses:
- Artificial Analysis Intelligence Index v4.1.
- 430 model releases across 16 selected model creators.
- 26 releases that established a new all-provider frontier record.
- A historical period from 2022-11-30 to 2026-07-16.
- 45 equally spaced monthly frontier observations for the timeline fit.
- A quadratic timeline fit with R² = 0.9905.
I did not estimate release values from screenshot pixels. The model names, release dates, creators, and Intelligence Index values were extracted from the data behind the live chart. The screenshot is the visual starting point; the structured release data is the analytical input.
How fast has frontier AI intelligence grown?
The key observed frontier levels were:
- 3.57 on 2022-11-30.
- 11.80 on 2024-07-16.
- 33.28 on 2025-07-16.
- 59.86 on 2026-07-16.
Across 3.625 years, the frontier gained 56.29 points. That gives an end-to-end average of 15.53 points per year. An OLS fit over the record-setting releases gives a nearly identical long-term slope of 15.66 points per year.
The more recent observations are faster:
- The frontier gained 21.47 points from July 2024 to July 2025.
- It gained 26.59 points from July 2025 to July 2026.
- The fitted velocity at the end of the monthly timeline is 32.72 points per year.
That final number is a derivative, not the literal score increase during the previous calendar year. The observed last-year gain was 26.59 points. The fitted current velocity of 32.72 points per year describes how steep the fitted curve is at the endpoint.
AI model releases that set new frontier records
2022-11-30— OpenAI: GPT-3.5 Turbo — 3.572023-03-14— OpenAI: GPT-4 — 7.012023-11-06— OpenAI: GPT-4 Turbo — 7.892024-03-04— Anthropic: Claude 3 Opus — 11.802024-09-12— OpenAI: o1-preview — 17.042024-12-05— OpenAI: o1 — 23.442025-02-24— Anthropic: Claude 3.7 Sonnet (Reasoning) — 27.062025-04-16— OpenAI: o3 — 30.402025-05-22— Anthropic: Claude 4 Opus (Reasoning) — 30.972025-06-10— OpenAI: o3-pro — 32.522025-07-10— SpaceXAI: Grok 4 — 33.282025-08-05— Anthropic: Claude 4.1 Opus (Reasoning) — 33.712025-08-07— OpenAI: GPT-5 (high) — 34.712025-09-23— OpenAI: GPT-5 Codex (high) — 36.122025-09-29— Anthropic: Claude 4.5 Sonnet (Reasoning) — 36.422025-11-13— OpenAI: GPT-5.1 (high) — 36.872025-11-18— Google: Gemini 3 Pro Preview (high) — 39.552025-11-24— Anthropic: Claude Opus 4.5 (Reasoning) — 40.772025-12-11— OpenAI: GPT-5.2 (xhigh) — 42.182026-02-05— OpenAI: GPT-5.3 Codex (xhigh) — 44.272026-02-17— Anthropic: Claude Sonnet 4.6 (Adaptive Reasoning, Max Effort) — 47.212026-03-05— OpenAI: GPT-5.4 (xhigh) — 51.402026-04-16— Anthropic: Claude Opus 4.7 (Adaptive Reasoning, Max Effort) — 53.532026-04-23— OpenAI: GPT-5.5 (xhigh) — 54.842026-05-28— Anthropic: Claude Opus 4.8 (Adaptive Reasoning, Max Effort) — 55.692026-06-09— Anthropic: Claude Fable 5 (Adaptive Reasoning, Max Effort, Opus 4.8 Fallback) — 59.86
These 26 releases matter because they define the upper envelope. Hundreds of models can launch without changing the frontier. For this question, the record setters carry the signal.
AI growth rate, velocity, and acceleration
The long-term fitted velocity is:
15.6606 points/year
The current fitted velocity is:
32.7249 points/year
The ratio is:
32.7249 / 15.6606 = 2.0896
The frontier is therefore improving about 2.09 times as fast as its long-term historical rate.
The quadratic fit also gives an additive second derivative of:
9.5779 points/year²
That 9.58 figure is useful for describing the historical curve. It was not, however, the right mechanism for the final forecast.
Why the AI forecast model changed
My first forecast added a fixed acceleration term directly to the index:
I(t) = I₀ + v₀t + ½at²
That produced several curves that ended almost on top of one another. Over a short horizon, the additional ½at² contribution is small. Mathematically the curves were valid, but they did not represent the assumption I actually wanted to test.
The stronger assumption is about the velocity itself: what if the speed of frontier improvement keeps increasing at the rate implied by the historical timeline?
The current velocity is 2.0896 times the long-term velocity. Spread across 3.625 years, the implied annual velocity multiplier is:
m = (current velocity / long-term velocity)^(1 / historical years)

m = (32.7249 / 15.6606)^(1 / 3.6250)

m = 1.22545
That corresponds to an annual increase in growth velocity of:
1.22545 - 1 = 0.22545 = 22.545%
Rounded for communication: the growth velocity has compounded by roughly 22.5% per year. That is close to a 1.25× annual velocity scenario.
The AI acceleration forecast function
The forecast starts on 2026-07-16 with:
- Initial index
I₀ = 59.8606. - Initial velocity
v₀ = 32.7249 points/year. - Annual velocity multiplier
m = 1.22545. - Time
tmeasured in years after 2026-07-16.
The velocity compounds over time:
v(t) = v₀ × mᵗ

v(t) = 32.7249 × 1.22545ᵗ
The Intelligence Index is the integral of that increasing velocity:
I(t) = I₀ + ∫₀ᵗ v(s) ds

I(t) = I₀ + v₀ × (mᵗ - 1) / ln(m)
With the fitted values:
I(t) = 59.8606
     + 32.7249 × (1.22545ᵗ - 1) / ln(1.22545)
This is the central scenario used in the two forecast slides.
AI intelligence forecast for spring 2027
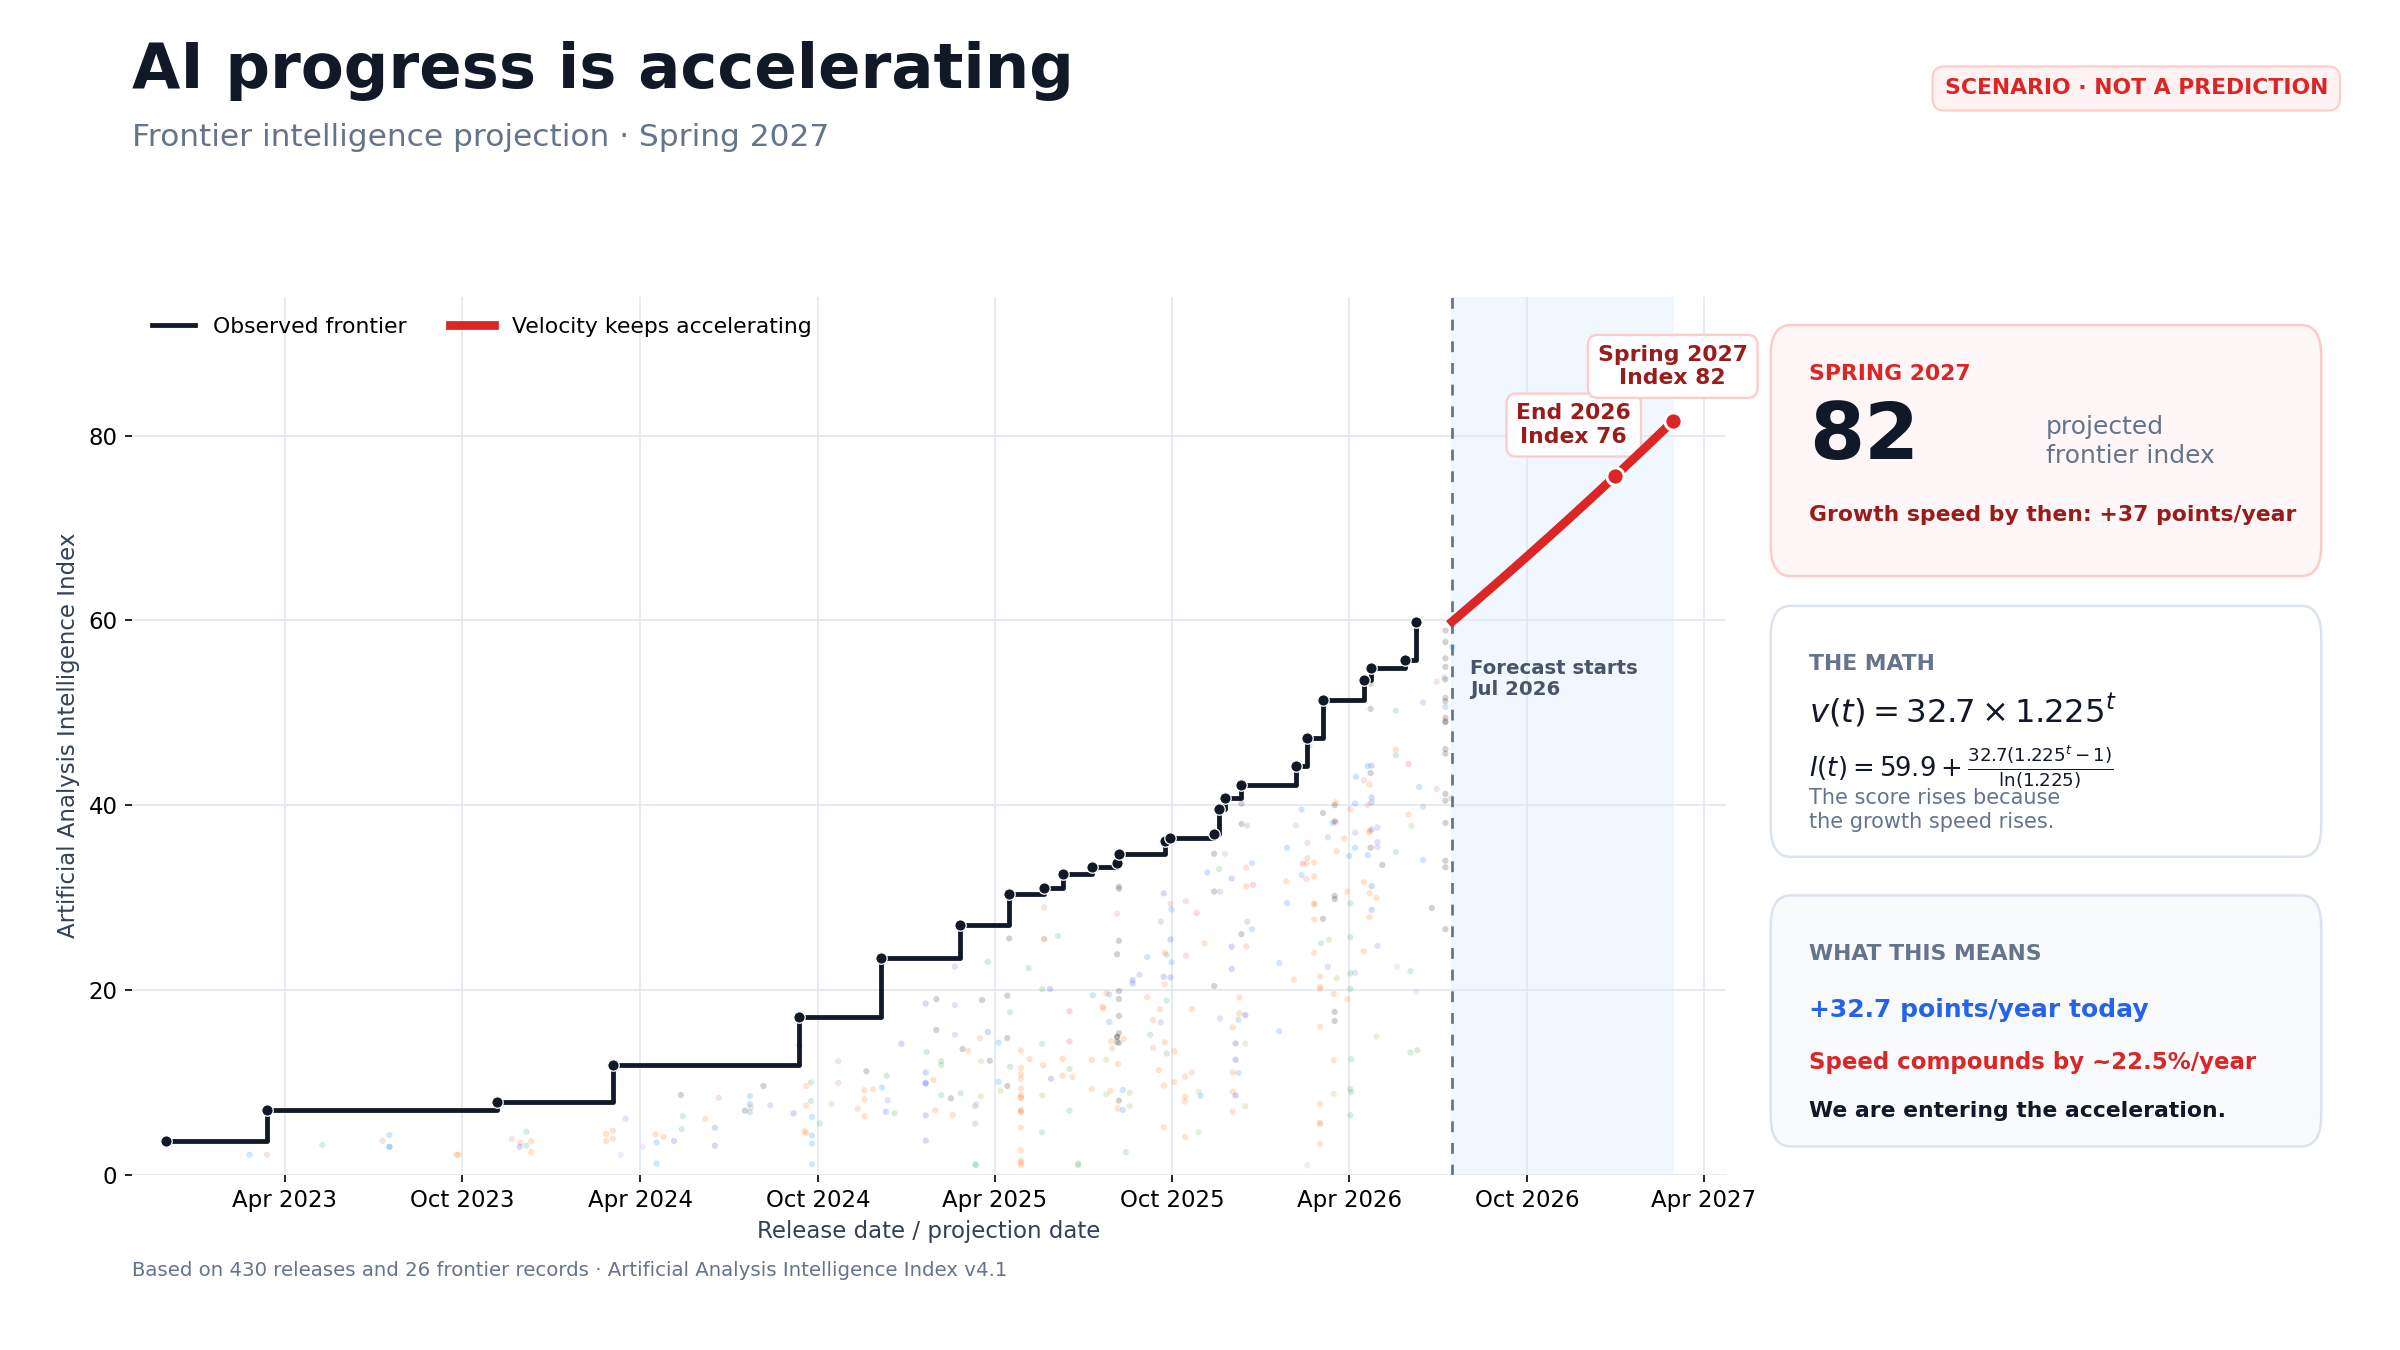
Spring 2027 scenario: projected Intelligence Index 81.5, with frontier velocity around 37.1 points per year.
The spring view deliberately uses a short horizon. It shows the immediate implication of the model without pretending that compounding becomes visually dramatic overnight.
AI intelligence forecast for the end of 2028
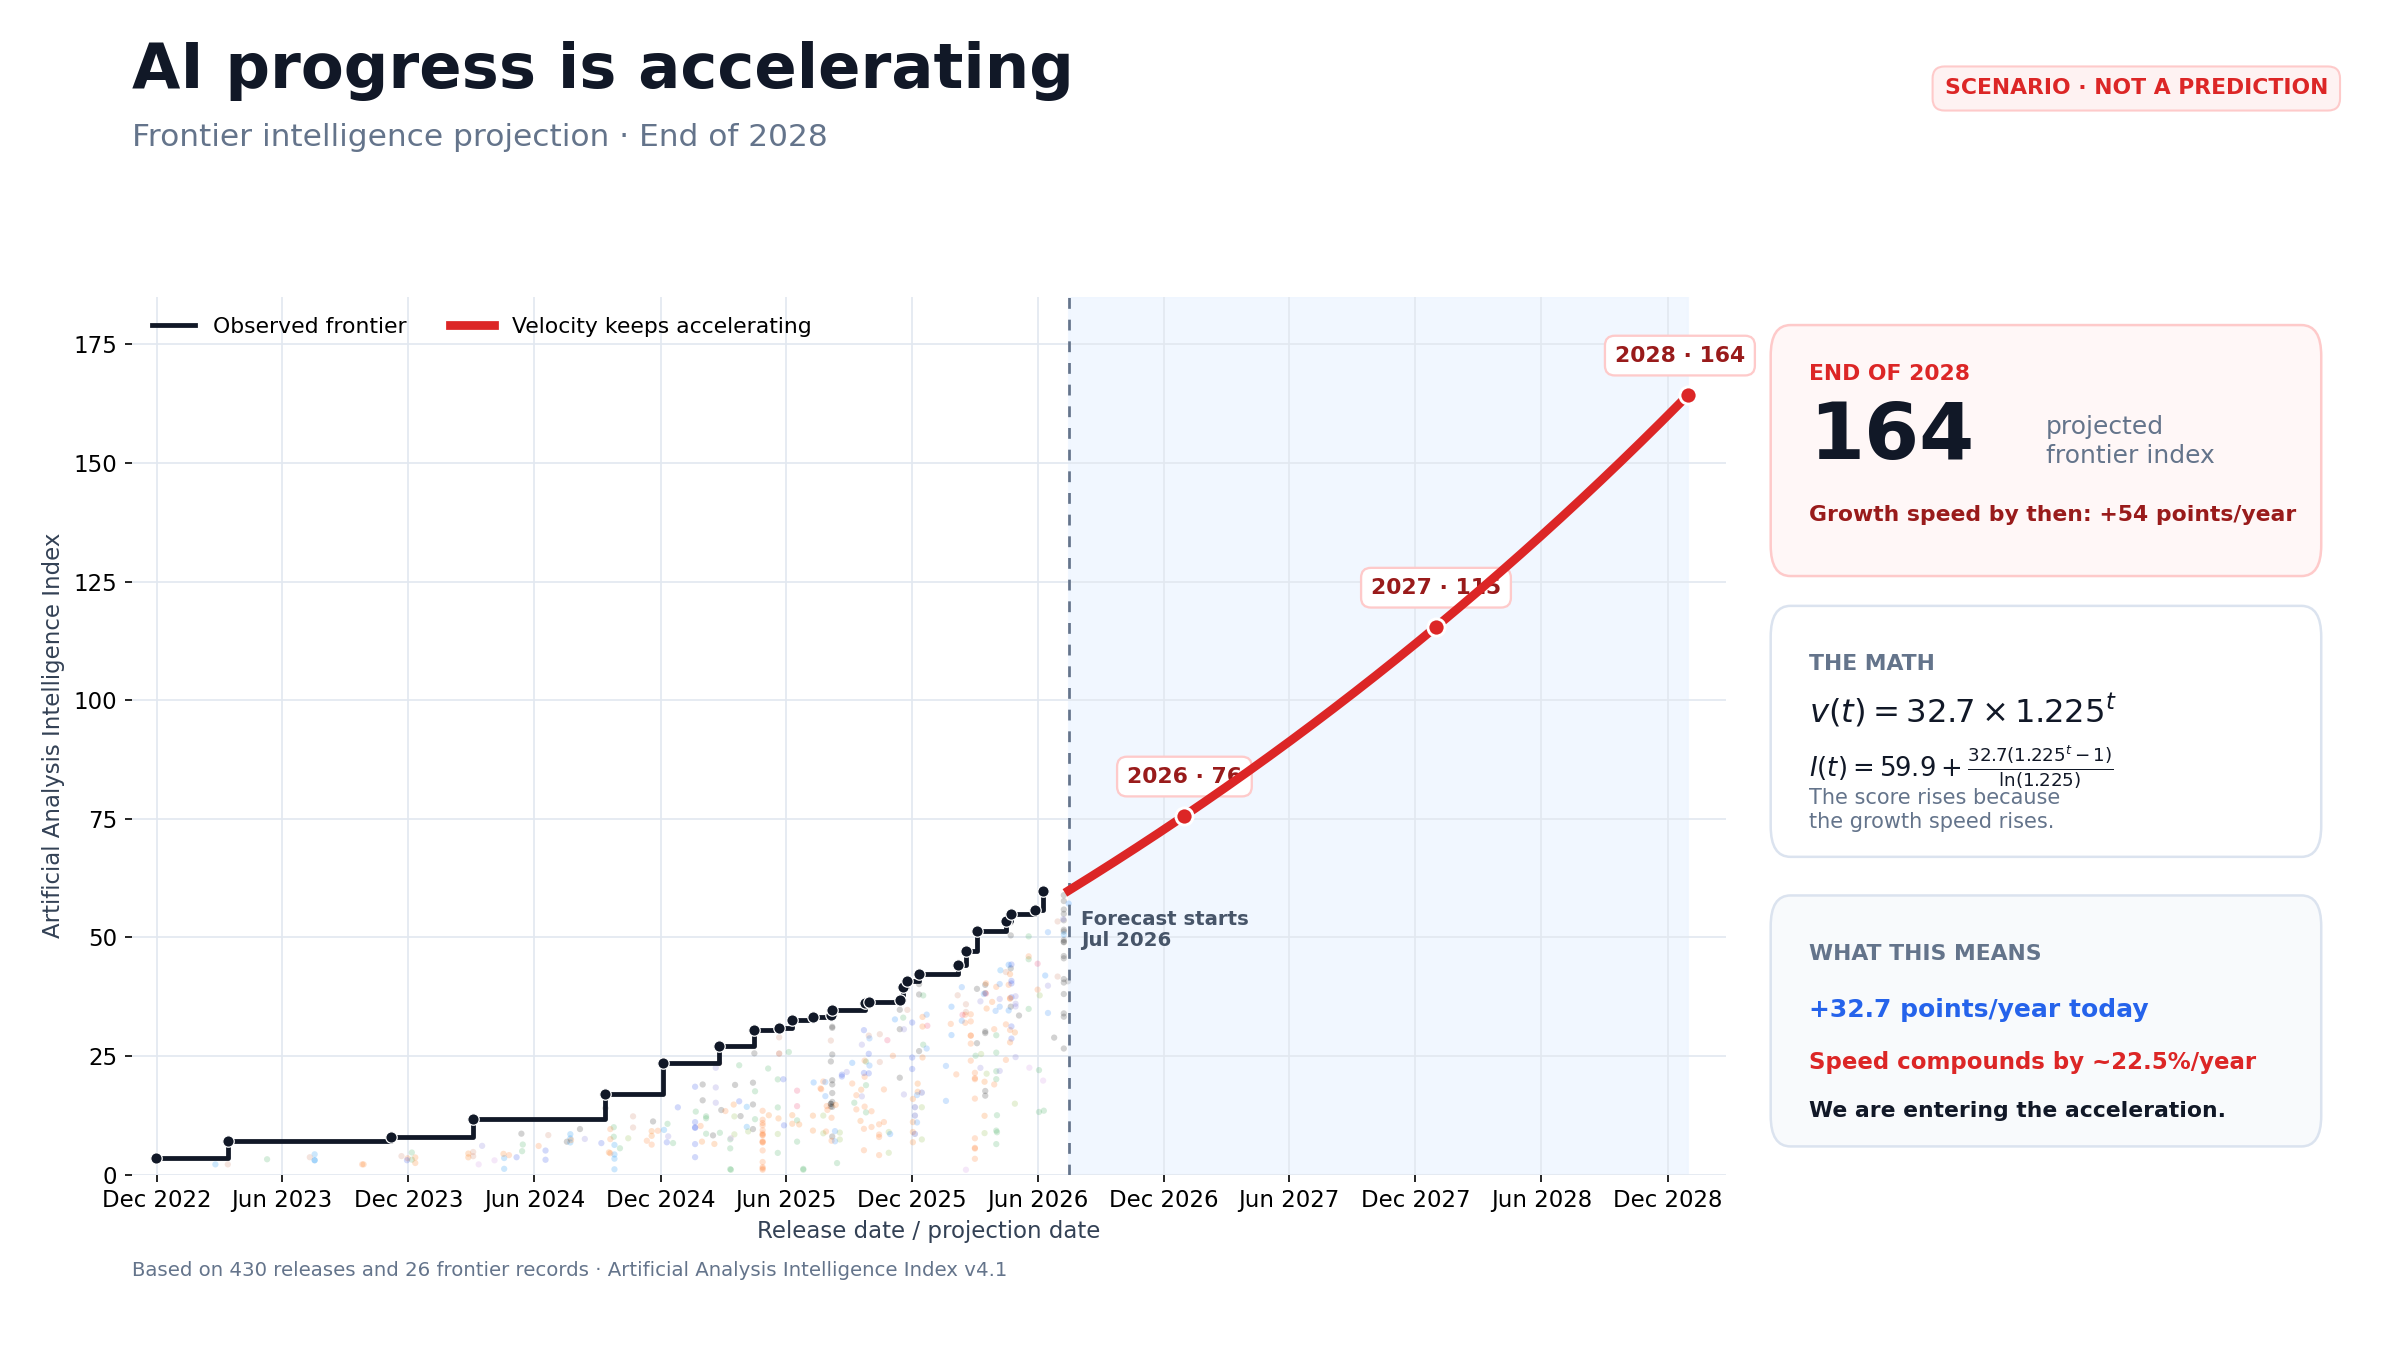
End-of-2028 scenario: projected Intelligence Index 164.4, with frontier velocity around 54.0 points per year.
The central projection is:
- End of 2026: index 75.6; velocity 35.9 points/year.
- Spring 2027: index 81.5; velocity 37.1 points/year.
- End of 2027: index 115.5; velocity 44.0 points/year.
- End of 2028: index 164.4; velocity 54.0 points/year.
From July 2026 to the end of 2028, the scenario adds approximately 104.5 Intelligence Index points.
What the AI acceleration forecast means
This is a scenario, not a prediction, confidence interval, or claim that the index will definitely reach 164.4.
The calculation assumes that:
- The historically inferred increase in frontier velocity continues.
- No major structural break changes the trajectory.
- The Artificial Analysis Intelligence Index remains comparable over time.
- Capability improvements near the benchmark frontier continue to be reflected by the index.
The exact endpoint will be wrong. The direction is the part I keep thinking about: progress is getting faster because the speed of progress is increasing too.
That changes the questions.
For white-collar work, what happens when the useful capability boundary moves materially within planning cycles rather than between them? For software, what should teams build when model assumptions can become stale before the product is fully rolled out? For society, which institutions can adapt at the speed implied by the technology, and which ones cannot?
The point is not that one fitted curve answers those questions. The point is that a constant-rate mental model may already be the wrong starting point.
We are entering the acceleration.
Artificial Analysis source data and reproducibility
The public source is the Artificial Analysis model intelligence timeline. The original discussion and social post are available on LinkedIn.
The supporting artifacts include the full 430-release dataset, the 26 record-setting frontier releases, the monthly projection values, and the scripts used to generate both forecast slides. The source data belongs to Artificial Analysis; the transformation, fitting choices, scenario design, and visualizations are documented here so the reasoning can be inspected rather than hidden behind a chart.